This is just a quick note that I have an Op-Ed appearing in the Baltimore Sun today. I discuss how the United States has seen a slow erosion in the appreciation for and respect of science. We need to recognize this trend, and fight back by engaging with our fellow citizens on scientific topics.
10 Ways You Can Be a Better Advocate for Science
This Saturday, marches in support of science will be held in hundreds of cities across the globe. The event should be an excellent opportunity to reinject science back into the public consciousness.
The American Association for the Advancement of Science (AAAS), the world’s largest general scientific society, held an event on April 19 offering advice on how to advocate for science beyond the march. Here I share some of their strategies for interacting with Congress, the media, and the public.
CONGRESS
Despite what many people think, citizens can influence Congress. In fact, a survey of those in positions of authority within Congressional offices reported that when their representative has not already arrived at a firm decision on an issue, contact from a constituent is about five times more persuasive than from a lobbyist.
Being influential, however, is about more than just being right. Congressional offices receive roughly 250 requests per day, so there are a few things you can do to stand out in an office that is essentially a triage unit.
- Ask for something concrete your representative can realistically deliver on.
- Explain why it is urgent.
- Make your pitch concise (< 10 minutes) and develop a one-page handout to leave after the meeting. Keep politics out of it!
- Be engaging! Tell a real story, preferably about someone who has one foot in your world, and one foot in your representative’s.
While your initial contacts with an office may be met with no response, be persistent. You can get that meeting!
MEDIA
Scientists are considered the most trustworthy spokespersons for science. But communicating effectively with the media requires that you do your homework and know your audience (e.g. business, technical, students).
You will want to have a well-honed, practiced elevator pitch. It should succinctly lay out the research problem, why it matters, and what the take home message is (i.e. what you can say that will lead to a longer conversation). You can always bridge back to it if you get questions you are not ready for, or if the interview otherwise is not going smoothly. Ask the reporter how they plan to frame the article. Use that as an opportunity to correct any inaccuracies.
It’s advantageous to build personal relationships with journalists. Inviting them to visit your laboratory, sending them relevant background information, connecting on social media, and just generally being cordial can help you become a trusted and go-to source.
PUBLIC
Perhaps the most important question to ask yourself when communicating science to the public is, “Why am I doing this?” Perhaps it is to increase interest in science, or to share knowledge. Maybe you want to inspire the next generation to enter the discipline, or increase trust between scientists and the public.
Once you are clear about your purpose, abide by these tenets:
- Don’t “dumb down” your science or treat your audience like idiots. Disdain is an ineffective communication technique.
- Ditch the jargon. For example, the public has a different understanding of the phrase “positive feedback” than scientists do. Instead use something more clearly understood, like “vicious cycle.”
- Create a dialogue so that you know where your audience is at. Let them know they are being heard.
- Reverse the order of a scientific talk. Start with the conclusions, explain why the issue matters, then finish with the background details.
IN CONCLUSION
Be enthusiastic! Put your own face on science and demonstrate what keeps you motivated. Offer solutions, and sidestep landmines (e.g. focus on clean energy with someone who thinks climate change is a hoax).
Doing all of this on your own can be daunting and time consuming. Know the resources to make your life easier. Contact your university, institute, or relevant scientific society to collect their outreach materials. Find groups in your local community that you can partner with, like those who are already gathering an audience and where you might be permitted to speak.
There are many other available resources. Research!America holds science communication workshops that train people to better communicate medical research. Spectrum Science Communications helps “develop unique stories that create game-changing conversations to influence audiences and differentiate your brand.” AAAS is launching an advocacy toolkit, and many disciplinary organizations, like the Society for Neuroscience and American Physical Society have their own resources.
What a Trump Presidency Means for Science
Donald Trump’s election has worried many Americans for a variety of reasons. One of those reasons – and one that was largely ignored during the campaign – is its impact on science. Given Trump’s lack of firm policy proposals and occasionally contradictory statements, there is much uncertainty in this regard. For that reason, I want to delve into what we can expect from the new Republican establishment in three key areas – science funding, climate change, and the role of science in government.
In all likelihood, the amount that the U.S. spends funding scientific research will be tightly linked to our total discretionary spending (i.e. non-military, non-entitlement). Trump has promised to dramatically increase military spending, keep entitlements fixed, and lower taxes without increasing the deficit. Discretionary spending would have to be cut under that scenario. While a budget for the current fiscal year (FY 2016-17) was supposed to be passed by October 1, Congress didn’t get it done in time. When this happens, they will pass a continuing resolution (CR) that continues funding the current year at the previous year’s levels.
That puts us in a position where one of two things is likely to happen. Either the current Congress can attempt to complete its own budget by the end of the year or, if it better serves their priorities, the Republicans can decide to pass another CR and wait to start fresh in 2017.
A continuing resolution may or may not be good news for scientists. The current proposed budget contains funding increases for some scientific agencies that could be lost if it goes unpassed. On the other hand, waiting until next year introduces the risk of significant spending cuts. Some of that money would probably be returned to the states, and could be redistributed to scientists through different channels, though that is far from guaranteed. Either way, scientific grants typically last for three to five years, so expect any funding changes to take years to work their way through the system.
It is important to distinguish between science that is nonideological, like health research, and that which has become ideological, like climate change. On the latter issue, Donald Trump has famously called climate change a “hoax” invented by the Chinese to reduce American competitiveness, a statement that ignores the substantial progress China is making in reducing its own emissions.
Trump has also expressed a desire increase usage of fossil fuels (including “clean coal”) and pull the U.S. out of the Paris Climate Agreement. While we are bound to this international treaty for at least the next four years, the President could opt to ignore its non-binding emissions targets. Failing to meet our commitments would diminish America’s moral authority and could disincentivize other nations, like India, from meeting their own targets.
America’s emissions pledges were based on a number of Obama-driven policies, like the Clean Power Plan (CPP), which directed the Environmental Protection Agency (EPA) to set limits on greenhouse gas emissions from power plants. The CPP will almost certainly be killed (expect legal challenges), but removing the federal requirement will not impede states from proceeding on their own, which many are. Furthermore, a Trump administration will be largely powerless to undo the economic forces that are leading to coal’s decline, chiefly the low price of natural gas.
Trump has expressed a desire to eliminate the EPA, but the agency will be difficult to do away with altogether, as this requires congressional approval and will be met by extremely strong political resistance. Heading the agency with noted climate denier Myron Ebell, as has been rumored, will not help matters, though. Ebell has called for the Senate to prohibit funding for the Paris agreement and the U.N.F.C.C.
However, the federal government is obligated under the 1970 Clean Air Act to regulate the emissions of carbon dioxide into the atmosphere. The Republicans may choose to defund the agency’s regulation efforts, an action that will almost certainly meet legal resistance from environmental groups and large swaths of the general public. While the Republicans will not be able to ignore the scientific evidence and mounting public pressure forever, any delay in implementation would be especially damaging given how far behind the curve we already are in our mitigation efforts.
Given Trump’s strong pro-fossil fuel statements, it’s possible that the Keystone XL pipeline will be approved by the U.S. State Department. Financial support for federally funded renewable energy technologies are at risk. The Alliance of Automobile Manufacturers has already requested of Trump’s transition team a rollback of the 54.5 miles per gallon fuel efficiency standards for cars and light-duty trucks by 2025.
A more general question is what role science will take within a Trump administration. President Obama nominated his chief science advisor John Holdren on inaugration day, signaling the position’s importance to his administration. Trump’s transition has been far less organized, and he has given little indication who his science advisor will be or what role they will serve. Even a qualified appointee could be effectively neutered if the Office of Science and Technology Policy (the office they would head) was disempowered, or if they were unable to permeate Trump’s inner circle. This position requires Senate confirmation, so it could potentially go unfilled for some time.
This would clearly be a mistake, as the next administration must be ready for future disasters like Deepwater Horizon or viral outbreaks that require being scientifically literate. It is unclear whether President Trump would prioritize the best scientific evidence over political considerations. The new administration will also have to consider whether the U.S. is to remain an active participant in international scientific enterprises like the International Thermonuclear Experimental Reactor (ITER) and whether there will be free movement of researchers. Trump’s tax proposals will answer whether he intends to incentivize private investment in basic research.
Executive agencies like the EPA and the National Oceanic and Atmospheric Administration (NOAA) are populated by career civil servants, many of whom are institutionally difficult to fire in order to protect them against political transitions. However, Trump has suggested downsizing the federal workforce by instituting a hiring freeze, reducing their job security, and reducing agency funding.
Even though Trump has expressed an interest in cutting the Department of Education, STEM education should largely be safe, especially since only about 10% of education funding comes from the federal government. Even Republicans realize that a highly educated workforce is a prerequisite for our international competitiveness.
Historically, science has been one of the few bipartisan issues. I suspect this will largely continue at the budgetary level, though the priorities may shift. I have reason to worry about federal climate mitigation efforts, but wonder whether Trump’s lack of a fully competent transition team might lead some lesser-known scientific programs to experience a kind of benign neglect. Either way, we must remain vigilant to ensure science is being represented as it should be.
How Big Data is Transforming Science
In the last 15 years, science has experienced a revolution. The emergence of sophisticated sensor networks, digital imagery, Internet search and social media posts, and the fact that pretty much everyone is walking around with a smartphone in their pocket has enabled data collection on unprecedented scales. New supercomputers with petabytes of storage, gigabytes of memory, tens of thousands of processors, and the ability to transfer data over high speed networks permit scientists to understand that data like never before.
Research conducted under this new Big Data paradigm (aka eScience) falls into two categories – simulation and correlation. In simulations, scientists assume a model for how a system operates. By perturbing the model’s parameters and initial conditions, it becomes possible to predict outcomes under a variety of conditions. This technique has been used to study climate models, turbulent flows, nuclear science, and much more.
The second approach – correlation – involves gathering massive amount of real data from a system, then studying it to discover hidden relationships (i.e. correlations) between measured values. One example would be studying which combination of factors like drought, temperature, per capita GDP, cell phone usage, local violence, food prices, and more affect the migratory behavior of human populations.
At Johns Hopkins University (JHU) I work within a research collective known the Institute for Data Intensive Engineering and Science (IDIES). Our group specializes in using Big Data to solve problems in engineering and the physical and biological sciences. I attended the IDIES annual symposium on October 16, 2015 and heard presentations from researchers across a range of fields. In this article, I share some of their cutting edge research.
HEALTH
The United States spends a staggering $3.1 trillion in health care costs per year, or about 17% of GDP. Yet approximately 30% of that amount is wasted on unnecessary tests and diagnostic costs. Scientists are currently using Big Data to find new solutions that will maximize health returns while minimizing expense.
The costs of health care are more than just financial. They also include staff time and wait periods to process test results, often in environments where every minute matters. Dr. Daniel Robinson of JHU’s Department of Applied Mathematics & Statistics is working on processing vast quanties of hospital data through novel cost-reduction models in order to ultimately suggest a set of best practices.
On a more personal level, regular medical check-ups can be time consuming, expensive, and for some patients physically impossible. Without regular monitoring, it is difficult to detect warning signs of potentially fatal diseases. For example, Dr. Robinson has studied septic shock, a critical complication of sepsis that is the 13th leading cause of death in the United States, and the #1 cause within intensive care units. A better understanding of how symptoms like altered speech, elevated pain levels, and tiredness link to the risk of septic shock could say many lives.
Realizing this potential has two components. The first is data acquisition. New wearable devices like the Apple Watch, Fitbit, BodyGuardian, wearable textiles, and many others in development will enable real-time monitoring of a person’s vital statistics. These include heart rate, circadian rhythms, steps taken per day, energy expenditure, light exposure, vocal tone, and many more. These devices can also issue app-based surveys on a regular basis to check in on one’s condition.
Second, once scientists are able to determine which health statistics are indicative of which conditions, these monitors can suggest an appropriate course of action. This kind of individualized health care has been referred to as “precision medicine.” President Obama even promoted it in his 2015 State of the Union Address, and earned a bipartisan ovation in the process. A similar system is already working in Denmark where data culled from their electronic health network is helping predict when a person’s condition is about to worsen.
Dr. Jung Hee Seo (JHU – Mechanical Engineering) is using Big Data to predict when somebody is about to suffer an aneurysm. Because of the vast variety of aneurysm classifications, large data sets are critical for robust predictions. Dr. Seo intends to use his results to build an automated aneurysm hemodynamics simulation and risk data hub. Dr. Hong Kai Ji (JHU – Biostatistics) is doing similar research to predict genome-wide regulatory element activities.
MATERIALS SCIENCE
The development of new materials is critical to the advancement of technology. Yet one might be surprised to learn just how little we know about our materials. For example, of the 50,000 to 70,000 known inorganic compounds, we only have elastic constants for about 200, dielectric constrants for 300-400, and superconductivity properties for about 1000.
This lack of knowledge almost guarantees that there are better materials out there for numerous applications, e.g. a compound that would help batteries be less corrosive while having higher energy densities. In the past, we’ve lost years simply because we didn’t know what our materials were capable of. For example, lithium iron phosphate was first synthesized in 1977, but we only learned it was useful in cathodes in 1997. Magnesium diboride was synthesized in 1952, but was only recognized as a superconductor in 2001.
Dr. Kristin Persson (UC Berkeley) and her team have been using Big Data to solve this problem in an new way. They create quantum mechanical models of a material’s structure, then probe their properties using computationally expensive simulations on supercomputers. Their work has resulted in The Materials Project. Through an online interface, researchers now have unprecendented access to the properties of tens of thousands of materials. They are also provided open analysis tools that can inspire the design of novel materials.
CLIMATE
Another area where Big Data is playing a large role is in climate prediction. The challenge is using a combination of data points to generate forecasts for weather data across the world. For example, by measuring properties like temperature, wind speed, and humidity across the planet as a function of time, can we predict the weather in, say, Jordan?
Answering this question can be done either by using preconstructed models of climate behavior or by using statistical regression techniques. Dr. Ben Zaitchik (JHU – Earth & Planetary Sciences) and his team have attempted to answer that question by developing a web platform that allows the user to select both climate predictors and a statistical learning method (e.g. artificial neural networks, random forests, etc.) to generate a climate forecast. The application, which is fed by a massive spatial and temporal climate database, is slated to be released to the public in December.
Because local climate is driven by global factors, simulations at high resolution with numerous climate properties for both oceans and atmospheres can be absolutely gigantic. These are especially important since the cost of anchoring sensors to collect real ocean data can exceed tens of thousands of dollars per location.
URBAN HOUSING
Housing vacancy lies at the heart of Baltimore City’s problems. JHU assistant professor Tamas Budavári (Applied Mathematics & Statistics) has teamed up with the city to better understand the causes of the vacancy phenomenon. By utilizing over a hundred publicly available datasets, they have developed an amazing system of “blacklight maps” that allow users to visually inspect all aspects of the problem. By incorporating information like water, gas, and electricity consumption, postal records, parking violations, crime reports, and cell phone usage (are calls being made at 2pm or 2am?) we can begin to learn which factors correlate with vacancy, then take cost effective actions to alleviate the problem.
WHAT’S NEXT?
As Big Data proliferates, the potential for collaborative science increases in extraordinary ways. To this end, agencies like the National Institutes of Health (NIH) are pushing for data to become just as large a part of the citation network as journal articles. Their new initiative, Big Data to Knowledge (BD2K), is designed to enable biomedical research to be treated as a data-intensive digital research enterprise. If data from different research teams can be integrated, indexed, and standardized, it offers the opportunity for the entire research enterprise to become more efficient and less expensive, ultimately creating opportunities for more scientists to launch research initiatives.
My personal research uses Big Data to solve a problem caused by Big Data. In a world in which researchers have more data as their fingertips than ever before, the uncertainty caused by small sample sizes has decreased. As this so-called statistical noise drops, the dominant source of error is systematic noise. Like a scale that is improperly calibrated, systematic noise inhibits scientists from obtaining results that are both precise and accurate, regardless of how many measurements are taken.
In my dissertation, I developed a method to minimize noise in large data sets provided we have some knowledge about the distributions from which the signal and noise were drawn. By understanding the signal and noise correlations between different points in space, we can draw statistical conclusions about the most likely value of the signal given the data. The more correlations (i.e. points) that are used, the better our answer will be. However, large numbers of points require powerful computational resources. To get my answers, I needed to parallelize my operations over multiple processors in an environment with massive amounts (e.g. ~ 1TB) of memory.
Fortunately, our ability to process Big Data has recently taken a big step forward. Thanks to a $30 million grant from the state of Maryland, a new system called the Maryland Advanced Research Computing Center (MARCC) has just come online. This joint venture between JHU and the University of Maryland at College Park has created a collaborative research center that allows users to remotely access over 19,000 processors, 50 1TB RAM nodes with 48 cores, and 17 petabytes of storage capacity. By hosting the system under one roof, users share savings in facility costs and management, and work within a standardized environment. Turnaround time for researchers accustomed to smaller clusters will be drastically reduced. Scientists also have the option of colocating their own computing systems within the facility to reduce network transmission costs.
The era of Big Data in science, which started with the Sloan Digital Sky Survey in 2000, is now in full force. These are exciting times, and I cannot wait to see the fruits this new paradigm will bear for all of us.
Featured image: “server rack zoomed in” by CWCS Managed Hosting, used under CC BY 2.0 / image of server has been slightly windowed, “big data” words added
Is the Universe a Giant Fractal?
Fractals are objects that look the same on all scales. I’m sure many of you have seen pictures or videos of fractals, but if you haven’t or if you would like a reminder, check out this visual representation posted on YouTube. As a cosmologist who has studied the large scale structure of the Universe, I find the question of whether the Universe is itself a giant fractal pretty interesting.
Before we can dive deeper into this question, some background information is required. The prevailing conclusion in cosmology is that the Universe originated in a Big Bang from which all matter and energy was set in motion. Though it was initially very close to uniform, tiny quantum perturbations made certain sections of the Universe slightly more dense than others. As gravity directed matter into these overdense regions structure slowly began to form. After billions of years this structure evolved into a massive collection of filaments and voids. The following video from the Millennium simulation displays a model of that structure on different length scales.
As the video shows, the Universe does appear somewhat similar on all scales except the smallest. That the Universe fails being a fractal at small scales should be obvious. After all, there are no galaxy-sized objects that look like glaciers, trees or chipmunks. Therefore if the Universe does possess fractal-like properties they must break down at some point. Above those scales, does the Universe look like a fractal? If so, does that fractal go on forever? If not, where does it cut off. Why? How do we know?
These are the questions I investigate in this post. Fair warning: this is about to get pretty wonky. Those valiant enough to proceed are encouraged to put on their math caps.
One way cosmologists quantify structure is through a statistic known as the two-point correlation function (2PCF). The 2PCF measures the probability of finding two galaxies separated by distance beyond what’s expected through random chance.
In three dimensions the two-point correlation function is often approximated as a power law,
(1)
where is a parameter whose value depends upon the particular distribution of galaxies. In two dimensions the 2PCF is a function of angle,
(2)
Note that if we add the number of Euclidean dimensions1The Universe possesses 3 Euclidean, or topological dimensions. This is another way of saying we live a three-dimensional Universe – up/down, left/right, in/out. We distinguish between Euclidean and fractal dimensionality since the latter can take non-integer values and more accurately describes fractals’ more complicated geometric properties. to the exponent of the 2PCF we obtain the same number, . This is known as the codimension. It turns out that if you have a random process with a power law correlation function, when you project it into lower dimensions the codimension does not change.
To put more substance behind this, let’s consider the two-point galaxy correlation function in greater depth. To compute its value at any we populate a simulated volume with uniformly distributed2In this context “uniformly distributed” means the random points must have the same distribution the observed galaxies would in the absence of large scale structure. The geometry of the survey must therefore be taken into account. No random points may be placed in locations where galaxies could not be observed. If the number of observed galaxies decreases with distance as with magnitude-limited surveys, so too must the number of randoms. random points. We count the number of pairs of points separated by each distance and use the results to populate a so-called randoms-randoms histogram. We do the same for the galaxies to generate a data-data histogram. The ratio of these histograms, which is a measure of probability above and beyond what one would expect through random chance, is the 2PCF.3For more on this see Landy, S. D., & Szalay, A. S. 1993, Astrophysical Journal, 412, 64.
As an example consider a three-dimensional Universe in which all the galaxies lie along a straight line. We limit our focus to galaxies separated by a distance by imagining a spherical shell of radius The only data-data points would lie across the shell from each other, perhaps located at opposite poles. The number of galaxy pairs would scale as where is the linear galaxy density. The random points could lie anywhere within the spherical shell, contributing to a much greater number of pairs. The number of these pairs would scale as where is the volume density of the randoms.4 is the surface area of a sphere. When multiplied by the infinitesimal thickness it becomes the volume of a very thin spherical shell. The correlation function would then go as
(3)
By a similar argument if all the mass in the Universe was on a plane, then the number of data-data pairs would go as where is the galaxy area density.5A plane (of galaxies in this instance) intersected with a spherical shell creates a circular ring. The circumference of that ring is . When multiplied by the ring’s thickness we get the area of the ring. In this case the correlation function would go as
(4)
The codimension of the linear Universe is . The codimension of the planar Universe is 2.
The reason this matters is that a random process (like the distribution of galaxies) with a power law correlation function has a lot in common with fractals.6Though it might seem counterintuitive, the distribution of galaxies is considered to be a random process. That is, there could be an infinite number of different Universes that each have the same 2PCF. This is analogous to many people rolling a die a large number of times. Each person will roll numbers 1 through 6 in a different order even though the probability of rolling each number is identical for all of them. In fact, simulating the positions of galaxies is sometimes referred to as rolling the dice. To see how, let’s examine the concept of dimensionality a bit more rigorously.
Imagine intersecting familiar geometric objects with a sphere and then doubling the radius of the sphere. What happens? If the object is a line, the length of the line inside the sphere will double. This means it increases by a factor of . If the object is a flat plane, the area of the plane inside the sphere will quadruple. This means it increases by a factor of . In these examples the exponent tells you the dimensionality of the object. A line is 1-dimensional. A plane is 2-dimensional.7I have taken the radius of the sphere to increase by a factor of 2, but note that the argument works for any factor , e.g. changing the radius of the sphere from to scales the area of the intersecting plane by .
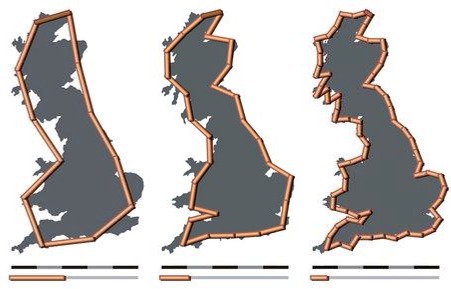
While lines and planes are relatively simple objects, the boundaries of fractals are not. In fact, the length around a fractal shape depends upon how fine a ruler one uses. For example, consider the images of the United Kingdom’s coastline below. The shoreline appears jagged on all scales and can be approximated to be a fractal. As the resolution of the ruler increases, so too does the length of the coastline. And because fractals have infinitely dense structure, the closer you look the longer the edge gets. For this reason the edges of pure fractals are often considered infinite in length.
When you intersect a fractal with a sphere and double its radius, the spatial content of the fractal doesn’t necessarily double or quadruple – it increases by a factor where is known as the fractal dimension. And unlike in Euclidean geometry, the fractal dimension does not need to be an integer.8The fractal dimension is also a measure of the complexity of a fractal’s boundary. There are formal defintions of , but those are omitted here.
It is somewhat comforting that for a straight line and for a flat plane, i.e. for simple cases the Euclidean and fractal dimensions are identical. But if a line is somewhat curved, it will have a fractal dimension close to but greater than 1. If a line is so tangled that it almost maps out an entire area, it will have a fractal dimension close to but less than 2. A similar logic applies to surfaces. A slightly curved surface will have a fractal dimension somewhat larger than 2 while a surface so folded that it practically maps out the entire volume will have a fractal dimension somewhat smaller than 3.
The essential connection between these examples is that the codimension and the fractal dimension are actually measuring the same thing. A linear Universe has a codimension of 1 and the fractal dimension of a straight line is . A planar Universe has a codimension of 2 and the fractal dimension of a plane is .
This relationship is nontrivial. Dimensionality is a measure of how the spatial extent of a geometric form scales within a volume. The codimension is a measure of how objects are distributed relative to a purely random distribution. They are fundamentally different things, yet in the context of power law 2PCF they wind up being equal.
And while these are just the edge cases, this conclusion holds equally well for . In other words, if we know the two-point correlation function, we know the fractal structure of the Universe!
So if the Universe is indeed a fractal, what is its mass? The answer depends upon the radius of the sphere within which we measure it. For a sphere centered on position we might use an equation like this,
(5)
where is the density at position , is a top-hat window function9The top-hat window function equals 1 when is within a distance of and equals zero otherwise. It exists to limit the integration to the interior of the sphere. and is the dimensionality of the fractal10For conventional three-dimensional objects . When integrating over surfaces we use .. To find the average fractal mass within a radius we would average over many positions.
Regardless of the particulars of the density function , the mass of a fractal is proportional to length raised to the power, or . The mass density of a fractal therefore scales as
(6)
Experiments have shown that in our Universe,
(7)
We might naively conclude from this that the fractal dimension of all space is . This lands close to the truth but misses an important point. When , we have . It therefore follows from equation 6 that as . In other words, the mean density of a fractal with is zero.
Our Universe has a nonzero density , so something doesn’t quite fit. The explanation lies in the definition of the two-point correlation function. Recall that the 2PCF quantifies the probability of finding galaxies above what’s expected through random chance. If we represent the density of the Universe as the sum of a background component and a perturbative component above and beyond that of an expected background, we have
(8)
The density of the Universe is not what exhibits fractal properties. Rather, it is the density atop the background that does. Because is a perturbation from the mean, it has an expected value of zero when averaged over all space,
(9)
and thus satisfies the requirement that the mean density go to zero as .
I close with the following conclusion – the Universe does behave like a fractal as long as its two-point correlation function follows a power law relationship. Where the 2PCF fails to be modeled by equation 1, the equality between the codimension and fractal dimension no longer holds and the rest of the argument breaks down.11The approximation of the 2PCF as a power law works well for intermediate length scales. At small separations (e.g. the size of galaxies) the growth of structure is governed by factors far more complicated than simple gravity like supernovae, shockwaves, tidal forces, accretion disks, etc. At large separations parcels of matter are so distant that they have yet to have time to affect each other.
Featured image: “Stardust Memories” by Anua22a, used under CC BY-NC-SA 2.0 / Cropped from original
Britain fractal coastline image:
Notes
↑1 | The Universe possesses 3 Euclidean, or topological dimensions. This is another way of saying we live a three-dimensional Universe – up/down, left/right, in/out. We distinguish between Euclidean and fractal dimensionality since the latter can take non-integer values and more accurately describes fractals’ more complicated geometric properties. |
---|---|
↑2 | In this context “uniformly distributed” means the random points must have the same distribution the observed galaxies would in the absence of large scale structure. The geometry of the survey must therefore be taken into account. No random points may be placed in locations where galaxies could not be observed. If the number of observed galaxies decreases with distance as with magnitude-limited surveys, so too must the number of randoms. |
↑3 | For more on this see Landy, S. D., & Szalay, A. S. 1993, Astrophysical Journal, 412, 64. |
↑4 | is the surface area of a sphere. When multiplied by the infinitesimal thickness it becomes the volume of a very thin spherical shell. |
↑5 | A plane (of galaxies in this instance) intersected with a spherical shell creates a circular ring. The circumference of that ring is . When multiplied by the ring’s thickness we get the area of the ring. |
↑6 | Though it might seem counterintuitive, the distribution of galaxies is considered to be a random process. That is, there could be an infinite number of different Universes that each have the same 2PCF. This is analogous to many people rolling a die a large number of times. Each person will roll numbers 1 through 6 in a different order even though the probability of rolling each number is identical for all of them. In fact, simulating the positions of galaxies is sometimes referred to as rolling the dice. |
↑7 | I have taken the radius of the sphere to increase by a factor of 2, but note that the argument works for any factor , e.g. changing the radius of the sphere from to scales the area of the intersecting plane by . |
↑8 | The fractal dimension is also a measure of the complexity of a fractal’s boundary. There are formal defintions of , but those are omitted here. |
↑9 | The top-hat window function equals 1 when is within a distance of and equals zero otherwise. It exists to limit the integration to the interior of the sphere. |
↑10 | For conventional three-dimensional objects . When integrating over surfaces we use . |
↑11 | The approximation of the 2PCF as a power law works well for intermediate length scales. At small separations (e.g. the size of galaxies) the growth of structure is governed by factors far more complicated than simple gravity like supernovae, shockwaves, tidal forces, accretion disks, etc. At large separations parcels of matter are so distant that they have yet to have time to affect each other. |
My Thesis Research
A lot of people ask me to describe my thesis research. I used to give a complicated answer about using covariance matrices to perform a Karhunen-Loève transform to blah blah blah, but now I just say, “I clean cosmic data.” Today I created a graphic that illustrates the essence of what I’m trying to do.
Notice how both the signal and noise have “structure”? My research attempts to uncover those structures and use them to eliminate the noise. The problem is that taking away noise also takes away signal. So we need a way to “fill in the gaps.”
Now imagine doing this not for images, but for MASSIVE data sets…and you don’t get to know what the letters are beforehand. Solving this problem to high accuracy is a challenge.
A 3D View into Mars’s Gale Crater
This is my very first three-dimensional panorama. Grab your red and blue glasses!
This image of Gale crater comes from the Curiosity rover. Five kilometers in the background you’ll see Mount Sharp, the crater’s central mountain. According to APOD, “the layered lower slopes of Mount Sharp, formally known as Aeolis Mons, are a future destination for Curiosity.”
Say Goodbye to Jade Rabbit
Click here to be transported into the footsteps of the ill-fated Chinese lunar rover, Jade Rabbit. On January 16, 2014, Jade Rabbit (known in Chinese as “Yutu”) completed an examination of the lunar soil. Nine days later, near the end of its second lunar day, China announced the rover had undergone a “mechanical control abnormality” due to complications caused by the “complicated lunar surface environment.” Now I’m no moon expert, but it seems to me that withstanding a lunar environment really needed to be one of Jade Rabbit’s core competencies.
While Jade Rabbit is able to communicate as of February 13, “it still suffers a mechanical control abnormality,” putting to bed its plan to explore the Moon’s Mare Imbrium. Its hibernations during the two-week long lunar nights will become increasingly irrelevant. But we still thank CNSA, Chinanews, Kennth Kremer & Marco Di Lorenzo for the image.
The panorama imaged above was taken from the Chang’e 3 lander.
Welcome to Everest on Mars
Click on the image below to be transported once again to the beautiful red rock in the sky, Mars!
Our specific destination is the pinnacle of Mars’s Husband Hill, which lies adjacent to Gusev Crater. Because of the elevation at which these photos were taken, the image below has been dubbed the “Everest panorama” in honor of Earth’s highest mountain. This view into Gusev Crater showcases rocks and rusting sand stretching out over vast plains. Further in the distance other peaks lie beyond sand drifts. If you look closely, you can even see a couple of faintly colored dust devils in red and blue.
The images, which are credited to the Mars Exploration Rover Mission, Cornell, JPL and NASA, were taken over the course of three days by the robotic Spirit rover in 2005. Spirit, which ceased operation in 2009, took the images to match what a human being with 20/20 eyesight would have seen standing in the same location.